
The loudest housing number this morning arrived with an error bar wider than itself
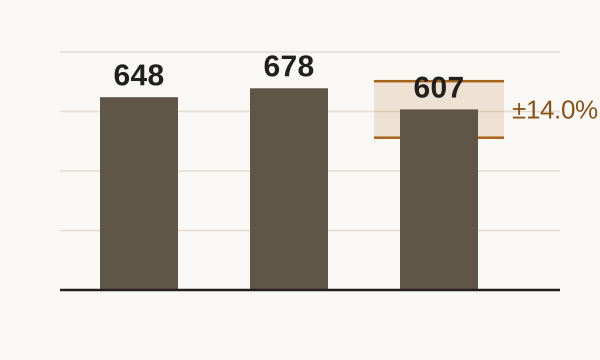
New single-family sales printed at a 607,000 annual rate for July, which the Census Bureau describes as 10.5 percent below June — and prints with a margin of ±14.0 percentage points. The figures around it, on unsold inventory, on repeat-sale prices and on how households read their own labour market, are measured more tightly and do not tell the same story.

At 10:00 Eastern this morning the Census Bureau and the Department of Housing and Urban Development put out their joint count of new houses sold in July. Sales ran at a seasonally adjusted annual rate of 607,000, which the release describes as 10.5 percent below June's 678,000 and 6.3 percent below the 648,000 of July last year.
Read the parentheses next to those numbers. The 10.5 percent decline is printed as 10.5 percent (±14.0 percent), and the annual decline as 6.3 percent (±19.6 percent). The interval around the monthly change is wider than the change itself: on the Bureau's own arithmetic the true movement between June and July sits somewhere between a decline of about a quarter and a modest increase. A monthly count of a few tens of thousands of transactions cannot be measured more finely than that, and the release does not pretend otherwise.
There is one figure in the same table that is measured finely. The seasonally adjusted stock of new houses for sale at the end of July was 488,000, and that is given as 1.9 percent (±1.2 percent) above June's 479,000 — the one change of the morning whose interval does not contain zero. Inventory is a count of listings rather than a sample of sales, and it accumulated. At July's sales rate that stock represents 9.6 months of supply, against 8.5 months in June and 9.2 months a year earlier, though both of those comparisons again come with intervals far wider than the moves.
The price lines in the release point in two directions at once. The median new house sold for $393,800 in July, 2.3 percent below June, while the average sold for $508,800, 4.1 percent above June. Median and average diverge when the mix of what sells changes rather than when a given house reprices, and a monthly sample of new construction is exactly where mix moves most.
Three minutes later S&P Dow Jones Indices published a measure built the other way round. The S&P Cotality Case-Shiller U.S. National Home Price NSA Index tracks repeat sales of the same houses, and for June it posted a 1.5 percent annual gain, up from 1.2 percent in May. Nominal growth firming and real values still falling are both true at once: the release notes that June's 3.5 percent inflation ran roughly two percentage points above that gain, the thirteenth consecutive month in which U.S. home values fell in real terms.
Underneath the national line the country is not one market. “For the fourth consecutive month, Chicago led all metros with a 6.9% annual increase in June, followed by New York (4.8%) and Cleveland (4.1%),” said Rebecca Kaufman, Associate Director of Commodities at S&P Dow Jones Indices. “Meanwhile, Seattle recorded the largest annual decline at 2.0%, followed by Las Vegas (-1.9%) and Denver (-1.2%).” Nearly nine percentage points separate the strongest metro from the weakest. One caveat travels with the June data: recording delays at the Wayne County office mean there is no valid June update for Detroit in this release, though May was calculated.
The households themselves were surveyed in the same window. The Conference Board's Consumer Confidence Index slipped 0.8 points to 89.4 in August, but the two halves moved apart. Assessment of the present rose 6.8 points to 121.2 after three months of decline, and the labour differential — the share saying jobs are plentiful minus the share saying they are hard to get — gained 4.8 points to +7.5 percent. Expectations for the next six months fell 5.8 points to 68.2, with the business-conditions component at -6.3 percent and the labour component at -11.5 percent. Income expectations softened by 3.1 points but stayed positive at +3.8 percent.
“The Expectations Index slipped further into negative territory, which was offset by a moderate rise in the Present Situation Index after declining in the past three months,” said Dana M Peterson, Chief Economist at The Conference Board. The survey's preliminary results cover 3–16 August, before this morning's housing figures existed.
What holds together across three publishers is narrow. Households judge the labour market they can see more kindly than the one they expect. The stock of unsold new houses is measurably larger than it was a month ago, and prices for existing houses are rising more slowly than the price level. What does not hold together is any confident statement about July demand, because the release that carries July demand also carries the reason it cannot be read that precisely. The next monthly count is scheduled for 24 September, and it will revise June and July as well as add August.