
Tokyo's underlying inflation returned to 2%; Japan's short yields rose and the long end did not follow
The Statistics Bureau's mid-month Tokyo index for August, published on 28 August, put prices excluding fresh food and energy 2.0% above a year earlier — the first reading at the Bank of Japan's target since March, and the third consecutive monthly rise across all three measures. The Japanese government bond curve answered in two voices: the two- and five-year sectors rose over the week while the thirty- and forty-year sectors ended it lower. Which part of the curve is still listening to Japanese inflation is the question underneath.

The Statistics Bureau of Japan published its mid-month preliminary consumer price index for the Tokyo ku-area for August 2026 on 28 August. On the 2025 base, the general index stood at 102.4, 1.9% above August 2025; the index excluding fresh food at 102.3, up 1.8%; and the index excluding both fresh food and energy at 102.6, up 2.0%. The last of those is the measure a central bank reads when it wants to know what domestic demand is doing without food and fuel speaking over it, and it is the first time it has printed at or above 2.0% since March, when it was 2.2%.
It is not a single month. Tokyo inflation bottomed in May 2026 on all three measures — 1.3% on the general index, 1.2% excluding fresh food, 1.5% excluding fresh food and energy — and has risen in each of the three months since: 1.6%, 1.8% and 1.9% on the general index, 1.5%, 1.7% and 1.8% on the core, 1.7%, 1.8% and 2.0% on the underlying measure. The seasonally adjusted monthly figures in the same release are firmer than the annual ones. The underlying index rose 0.4% in June, 0.3% in July and 0.3% in August. Compounding those three months gives roughly 4% a year — the desk's arithmetic on the bureau's own seasonally adjusted numbers, not a figure the bureau publishes. The year-on-year comparison is still carrying a weak spring; the monthly path is not.
The bond market did not read that as one message. Taking the Ministry of Finance's own daily yield table for the week from 21 to 27 August, the two-year JGB yield rose from 1.682% to 1.696% and the five-year from 2.146% to 2.182%. The ten-year added about a basis point and a half, from 2.882% to 2.897%. Then the direction reverses. The twenty-year is effectively unchanged, 3.760% to 3.764%. The thirty-year ended the week at 4.038% against 4.042%, and the forty-year fell from 4.069% to 4.043%. The gap between the ten- and forty-year sectors narrowed by about four basis points over those five sessions.
Two different prices are being set on one curve. The front of a government curve is a price on the policy rate: it is the market's arithmetic on what a central bank will do at meetings it can name, and the Bank of Japan's next Monetary Policy Meeting is on 17 and 18 September, on its own published 2026 schedule. A changed view of that meeting shows up in the two- and five-year sectors before it shows up anywhere else, and that is exactly where this week's Japanese selling was. The far end of the curve is a different instrument. At thirty and forty years the policy rate set at any one meeting is close to a rounding error, and what is being priced is the compensation demanded for holding duration through a supply of it nobody can pin down. A domestic inflation print moves the first market. It barely reaches the second.
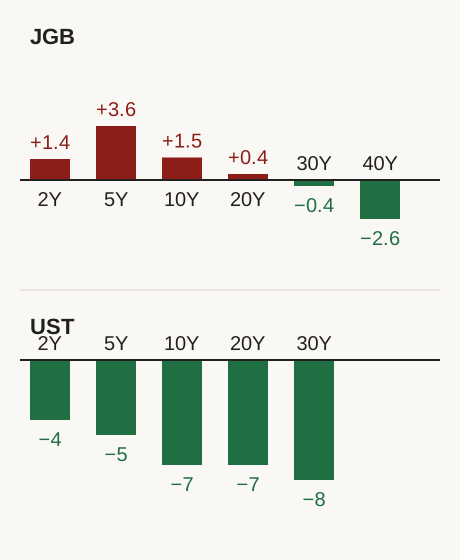
The same week supplies an unusually clean control. Over exactly the same span the entire US Treasury par curve fell: the two-year from 4.24% to 4.20%, the five-year from 4.43% to 4.38%, the ten-year from 4.74% to 4.67%, the twenty-year from 5.25% to 5.18% and the thirty-year from 5.27% to 5.19%, on the Treasury's own daily constant-maturity figures. Japan's front end therefore rose in a week when every American maturity rallied — a local policy trade moving against the global tide. Japan's thirty- and forty-year sectors, by contrast, drifted lower alongside the US long end, only far less. Read side by side, the two curves say the same thing about themselves: the short sector is national, and the long sector is not.
The level is worth stating plainly, because the distance is what makes the long end look strange. A thirty-year JGB yields 4.038% while Tokyo's underlying index is 2.0% above a year earlier. That is not a real yield — a real yield needs expected inflation over thirty years, not one city's spot print — and the Tokyo release is a mid-month preliminary for a single metropolitan area, published ahead of the national figure precisely because it is treated as a leading indicator rather than as the thing itself. But the arithmetic distance is the reason the long end is not obviously an inflation market. Whatever is holding a thirty-year above 4%, this month's inflation is not a sufficient explanation for it.
The countercase deserves more weight than the tidiness of the split invites. A fall of 2.6 basis points at forty years over a week sits inside ordinary daily noise. The honest observation is not that the long end moved, but that it did not extend the repricing it took on 21 August, when the thirty-year jumped from 3.995% to 4.042% in a single session and the forty-year from 4.002% to 4.069%. An absence of movement is weaker evidence than a movement, and it is compatible with more than one explanation. Nor is 2.0% an overshoot: the underlying measure is exactly at the target, and one month at target after four months below it is a return rather than a breach. A reading in which the Japanese front end is simply retracing part of a heavy week, and the long end is quiet because late August is quiet, is not refuted by anything above. This desk also read no yen level, no Japanese equity close and no futures-implied policy path at source for this week, so none is claimed here; the two curves and the price index are what the record supports.
Three things settle it, and each has a date or a published record behind it. The first is the national August index, which the bureau publishes after the Tokyo preliminary and which supersedes it; the two have differed before, and the national series is the one the Bank of Japan's target is written against. The second is the meeting on 17 and 18 September, where the front end's implied view either gets paid or does not. The third, and the most diagnostic, is the shape of the next move in the Ministry of Finance's own table. If the next sell-off carries the two- and five-year sectors while the thirty- and forty-year sectors hold, the split described here is a policy story the long end is entitled to ignore. If the long end leads the next move higher on a day carrying no Japanese data at all, then it was never listening to Tokyo's shopping basket, and the thing to watch is the supply calendar rather than the price index.