
The strongest ETF week since October says less than the headline: what a flow figure can and cannot carry
About $1.92bn went into United States spot bitcoin funds in a week, two-thirds of it through one issuer. The number is internally consistent and still cannot tell you about demand, leverage or next week. Here is what it does record, and the one cross-market condition worth naming beside it.

A weekly fund flow number is one of the most quoted and least understood figures in this market. It is a record of units created and redeemed in a primary market, settled after the fact between a handful of authorised firms and the fund. It is not a measure of how many people wanted the asset, and it is not a statement about next week.
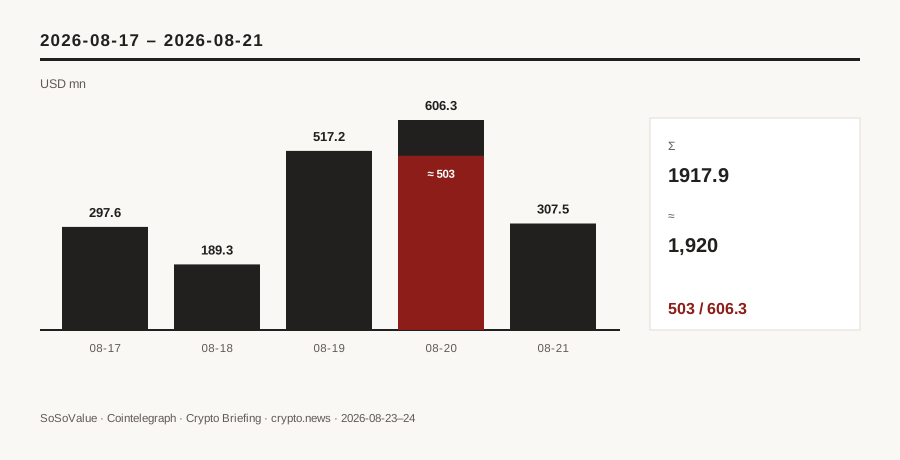
The figure itself is worth having. Cointelegraph reported on 24 August that United States spot bitcoin exchange-traded funds took in about $1.92bn over the previous week, the strongest weekly intake since October 2025, citing SoSoValue and Farside Investors. It put BlackRock's fund at roughly $1.33bn of that total across five consecutive days of inflow, with the largest single day near $503m on Thursday. Other outlets covering the same data described the week as the strongest in ten months.
Two arithmetic checks are available to any reader, and both hold. Secondary reporting of the same SoSoValue series gives daily totals of about $297.6m, $189.3m, $517.2m, $606.3m and $307.5m across the five sessions; those add to roughly $1,917.9m, which is the headline figure. And $503m against a $606.3m Thursday is about 83% of that day's intake from a single fund. The number is internally consistent, which is the most that can be said for it without a primary filing.
What the number cannot do is the interesting part.
It cannot separate gross from net. A net inflow is creations minus redemptions. A quiet net week can hide heavy two-way activity, and a large net week can sit on top of an equally large amount of switching. Nothing in the published figure distinguishes them.
It cannot separate directional buying from basis trading. A firm that buys the fund and sells futures against it is expressing a view on the gap between two prices, not on the asset. Those units are created exactly like anyone else's, and they appear in the same weekly figure.
It cannot separate new money from rotation. Units bought with proceeds from another vehicle holding the same asset are new to this wrapper and not new to the asset class.
And it is concentrated. Roughly two-thirds of the week sat in one issuer's book, and on the largest day about four-fifths did. A sentence about broad institutional demand is doing a lot of work on top of a fairly narrow set of tickets.
The cross-market reading is where care matters most, because the temptation is to draw an arrow from macro to flow and call it a mechanism. The honest version is narrower. The same week's official record shows the Federal Reserve's July minutes, released on 19 August, reporting that nominal Treasury yields rose 25 to 30 basis points over the intermeeting period, "driven by increases in real yields", alongside reserves within a range consistent with an ample supply. Real yields are the discount rate against which an asset paying no income is held, and liquidity conditions determine how easily leverage and basis trades can be financed. That is the channel a reader can name. It describes the environment in which allocation decisions were taken; it does not prove those decisions were taken because of it, and no flow series published to date can settle that question.
Three observations would sharpen or break this reading. First, if creations continue at similar size through a week in which real yields rise further, the real-rate framing is weaker than it looks and something else is driving the wrapper. Second, if the next negative week produces redemptions of comparable magnitude, this week was trading rather than allocation, and treating it as a durable shift was a mistake. Third, if totals hold while the largest issuer's share falls, the breadth that this week's coverage assumed would finally be present in the data.
Nothing here says where the price goes, and nothing here recommends holding, buying or avoiding this asset or any fund that tracks it. The point is smaller and more durable than a call: a flow figure is a fact about a wrapper, published with a lag and net of everything moving the other way, and the reader who treats it as a demand gauge will keep mistaking a settlement record for a crowd.